How Ukrainians Are Preparing for Winter 2026: A Social Media Analysis


From predictions of the “hardest winter yet” to scheduled power outages and water supplies: how the conversation changed, what fueled frustration, and how Ukrainians responded to new threats — a Minos study.
Back in August 2026, Ukrainians on social media were discussing how difficult the coming winter might be and what could be done to prepare. By late September, those conversations had become much more immediate. Russian strikes on energy infrastructure, scheduled power outages, and threats to essential services were dominating the discussion. On September 30, amid a large-scale Russian attack, Minos recorded 910 posts related to winter preparations in a single day — roughly 18 times the daily average in the August sample.
The share of posts classified as negative also grew, from 23% in the August sample to 38% in October, according to Minos. But personal posts expressing a clear opinion told a more nuanced story. In this group, the share expressing dissatisfaction with government authorities and public services fell from 63% to 43% in the later sample. Meanwhile, expressions of anxiety, resilience, and efforts to prepare independently became more common.
Anxiety and adaptation often went hand in hand. Alongside complaints about power outages and criticism of government decisions, people shared stories about buying portable power stations, storing water, and finding ways to keep everyday life running during possible disruptions.
To examine how the conversation was changing, we analyzed data collected through Minos Brand Watch by Molfar Intelligence. The monitoring covered two distinct periods: August 5–12 and September 28–October 7, 2026. Of the 6,547 posts initially identified, 3,215 remained after irrelevant content was filtered out.
The study shows which events coincided with the biggest spikes in discussion, which stories drew the highest shares of negative posts, how Kyiv became a major focus, and which practical preparations came up most often. These findings do not measure how well households or infrastructure are actually prepared for winter. They do, however, show how the public conversation around the coming season and its risks was evolving.
Key Takeaways
- Minos analyzed 3,215 relevant posts about winter preparations. That represents 49% of the 6,547 posts initially collected, after unrelated content was removed.
- Discussion peaked on September 30, with 910 posts in one day. That was approximately 18 times the August daily average of 50 posts.
- The share of negative posts rose from 23% to 38% between the August and October samples. At the same time, personal posts expressing a clear opinion showed more signs of anxiety, resilience, and individual preparations.
- Breaking news moved to the forefront. Between September 28 and October 7, 71% of relevant posts concerned attacks on infrastructure and outage schedules.
- Water supplies and backup power were the leading practical concerns. The most frequently mentioned preparations were storing water (187 posts), portable power stations (116), generators (106), and power banks (95).
- Kyiv was among the most negatively discussed topics. The capital appeared in 742 posts, or 23% of the relevant sample. Minos classified 56% of posts about Kyiv as negative.
The Sample, Sources, and Platforms
The conversation about winter preparations in Ukraine brought together several kinds of content: breaking news about strikes and power outages, statements by public officials, expert forecasts, and personal posts. To understand the discussion, it helps to look not only at how much was published, but also at who was sharing the information.
Using Minos Brand Watch, we collected 6,547 posts across two periods: August 5–12 and September 28–October 7, 2026. After removing advertising, unrelated everyday posts, and other irrelevant content, 3,215 posts remained in the final sample — 49% of the original dataset. These included 3,036 unique texts.
The August sample contained 402 relevant posts, compared with 2,813 in late September and early October. These were two separate monitoring periods, not continuous coverage of every post published over the intervening months.
The search covered Facebook, Telegram, Threads, X, YouTube, and LinkedIn. Most relevant posts were in Ukrainian (86%), followed by Russian (13%) and English (around 1%).
Which Platforms Saw the Most Discussion?
Facebook accounted for the largest number of relevant posts: 1,462, or 45% of the sample. Telegram came second with 846 posts (26%), followed by Threads, YouTube, and X.
The platforms also differed considerably in the share of posts classified as negative.
| Platform | Posts | Share of sample | Negative posts |
|---|---|---|---|
| 1,462 | 45% | 28% | |
| Telegram | 846 | 26% | 55% |
| Threads | 473 | 15% | 23% |
| YouTube | 217 | 7% | 36% |
| X | 216 | 7% | 42% |
Source: Minos. Post sentiment was classified automatically. These figures describe the analyzed sample, not the views of all users on each platform.
Telegram had the highest share of negative posts at 55% — almost twice Facebook’s 28%. On Threads, the figure was 23%.
That does not mean Telegram users were more worried about the coming winter. Each platform has a different mix of sources and content, so these figures primarily describe what was being published and shared there.
Who Shaped the Conversation?
News outlets and public information pages produced half of all relevant posts (1,608). They also accounted for 91% of the combined potential reach of the sources in the study.
Personal accounts contributed 1,019 posts, or 32% of the sample, but accounted for only 2% of potential reach.
The rest came from communities and other public pages (8%), official and municipal sources (7%), politicians and opinion leaders (2%), and pro-Russian channels (1%).
The total estimated potential reach of the relevant posts was approximately 559 million. This figure represents the combined audiences of the sources, not confirmed views or unique readers.
A large potential audience does not necessarily mean equally widespread personal discussion. In this sample, news outlets and information pages accounted for most of the potential reach, while personal posts made up nearly a third of the content but reached much smaller combined audiences.
That distinction also matters when interpreting emotional reactions. The overall tone of the conversation was heavily influenced by news coverage. Personal posts, meanwhile, offered a separate view of how individual authors expressed frustration, anxiety, resilience, or plans to prepare for winter.
How the Conversation Changed
Between the two monitoring periods, both the volume and nature of the conversation shifted. In August, forecasts and warnings about possible difficulties were among the prominent themes. By late September and early October, the focus had moved to breaking news about Russian strikes, the condition of energy infrastructure, and possible power outages.
From Warnings About the “Hardest Winter” to Reports of Attacks
In the August sample, prominent topics included government preparations for the heating season (17% of posts) and forecasts of a “difficult winter” (11%). Statements from officials and experts about risks to the energy system helped keep these issues in the conversation.
Activity remained relatively low during this period, averaging 50 relevant posts per day.
That changed sharply in late September. Overnight on September 30, Russia launched a large-scale missile and drone attack targeting energy infrastructure in Kyiv, the surrounding region, and other parts of Ukraine. According to Reuters, the attack led to emergency power outages in the capital and three regions. Minos recorded 910 relevant posts that day — approximately 18 times the August daily average.
The increase was not limited to a single day. Between September 28 and October 6, the number of relevant posts averaged 311 per day, more than six times the August level.
A second notable spike came on October 6, when reports about scheduled hourly power cuts and warnings of another possible large-scale attack spread widely.
The largest surges in activity therefore coincided not with general predictions of a difficult winter, but with specific events and warnings about threats to the power supply.
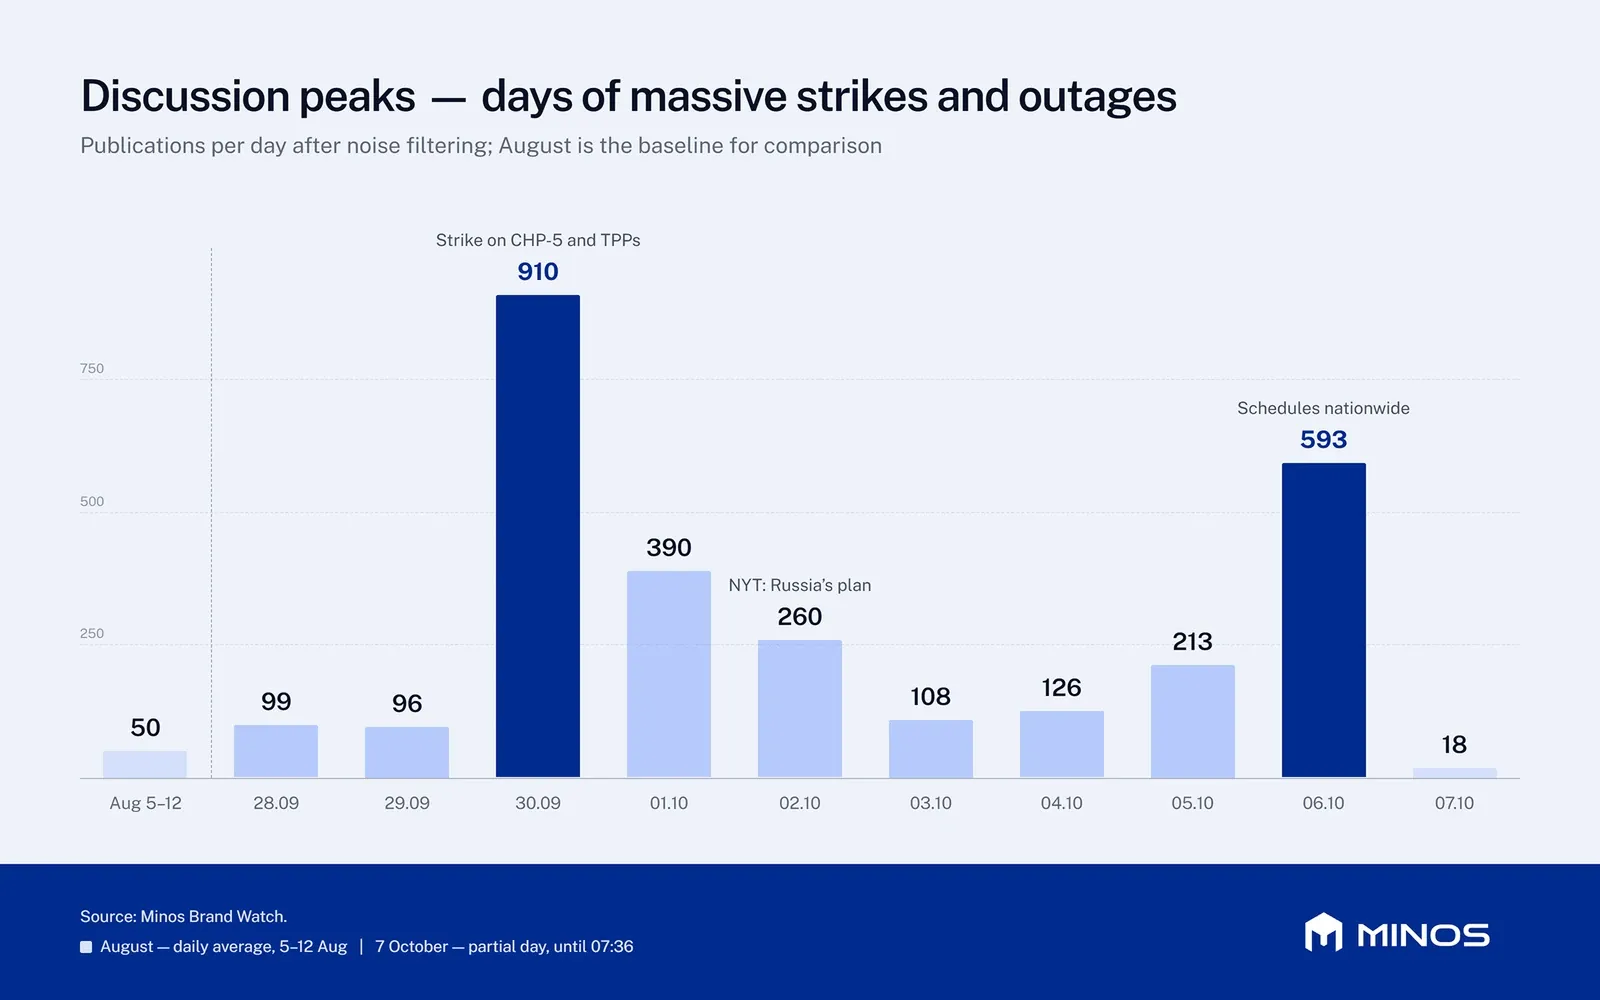
Source: Minos Brand Watch, August 5–12 and September 28–October 7, 2026. The chart shows two separate monitoring periods, not continuous activity from August through October. Data for October 7 covers only part of the day, through 7:36 a.m., and should not be compared directly with full-day figures.
What Dominated the Discussion?
As activity increased, the mix of topics changed as well.
In the September 28–October 7 sample, 71% of relevant posts concerned breaking news about attacks and outage schedules. Government decisions and funding for winter preparations appeared in 20% of posts, while the heating season and subsidies accounted for 18%, as did personal preparations (18%).
A single post could address several topics, so these categories overlap.
The share of posts classified as negative also rose. According to Minos, the share of negative posts increased from 23% in the August sample to 38% in the October posts.
That should not be read as a direct measure of how Ukrainians felt. Much of the material consisted of news about strikes, outages, and other threats — stories likely to be classified as negative because of the events they described.
The shift went beyond the sheer number of posts. In the later sample, the conversation was increasingly shaped by events as they unfolded, urgent warnings, and the practical challenges of possible power outages.
The Stories Driving the Conversation
Not every story about winter preparations attracted the same level of attention. The most widely discussed topics involved direct threats to everyday life: possible power cuts, damage to infrastructure, and interruptions to essential public services.
Sentiment also varied sharply by subject. Reports about attacks and outages were more often classified as negative, while information about government assistance and ways to prepare was more likely to be neutral or positive.
Power Outage Schedules Drew the Most Attention
The return of scheduled electricity outages was the most frequently mentioned specific topic in the dataset. It appeared in 690 posts with a combined potential reach of more than 202 million. Minos classified 54% of these posts as negative.
Unlike broad forecasts about a difficult winter, outage schedules pointed to changes people might face in their daily lives. Reports of possible electricity disruptions served both as breaking news and as a reason to question the readiness of Ukraine’s energy system.
Warnings about further Russian attacks also attracted attention. The study identified 58 posts specifically linked to the large-scale strike on September 30, of which 69% were classified as negative. That figure refers to one particular news story, not every post published on the day of the attack.
Another widely shared story concerned an alleged Russian plan for large-scale winter strikes on Ukraine’s energy infrastructure, described in an October 2 report by The New York Times. The story appeared in 59 posts, 64% of which were classified as negative.
These findings suggest that concrete threats, possible consequences of attacks, and disruptions to essential infrastructure drew more attention than general warnings about the winter ahead.
Kyiv: From Energy and Water to Bridges and Internet Access
Preparations in the capital became a major topic in their own right. Kyiv was mentioned in 742 posts — approximately 23% of the full relevant sample. Minos classified 56% of them as negative.
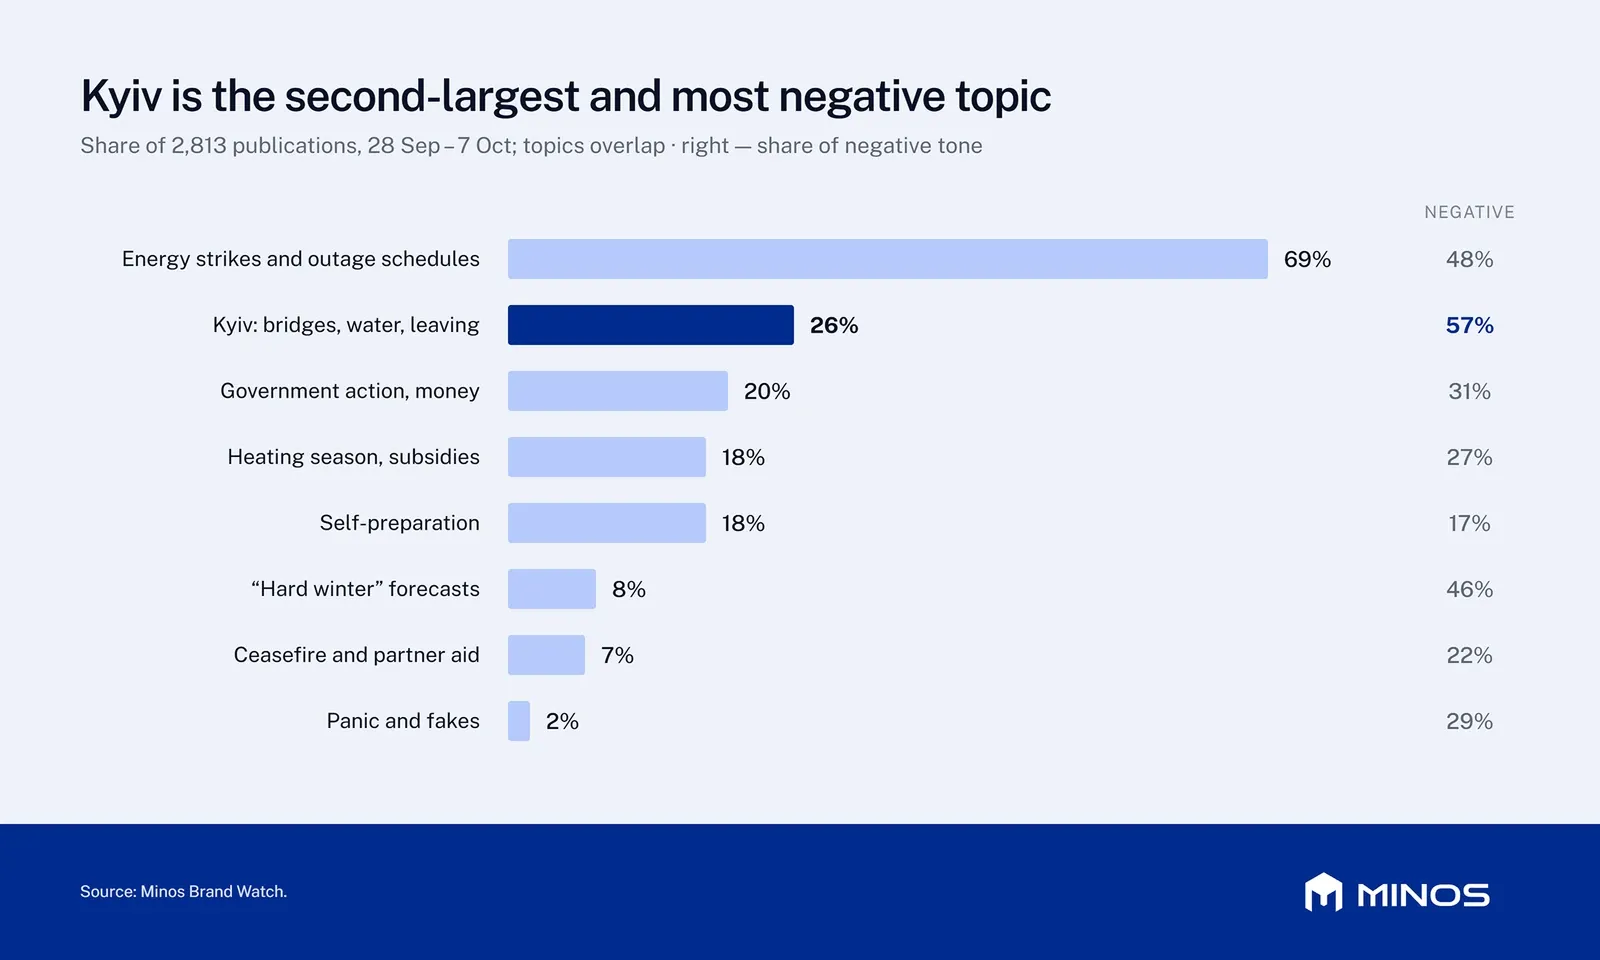
Source: Minos Brand Watch. The chart shows the breakdown of topics across 2,813 posts from September 28 to October 7, 2026. The category “Kyiv: bridges, water, and leaving the city” accounted for 26% of this sample, with 57% of posts classified as negative. The 23% and 56% figures in the text refer to all posts about Kyiv in the full sample of 3,215 relevant posts. Because the periods and topic categories differ, the two sets of figures are not directly comparable.
Among the recurring stories were warnings about threats to Kyiv’s bridges and water supply, as well as possible difficulties leaving the city. Bridges were mentioned in 82 posts, 45% of which were classified as negative.
Other infrastructure risks also drew attention beyond the capital. Water supply and sewage systems appeared in 125 posts, while potential attacks on data centers and internet disruptions were discussed in 53.
News and social media monitoring shows which reports about infrastructure threats were circulating and how they were classified by sentiment. It does not establish whether every claim was accurate or assess how prepared Kyiv actually was for the heating season.
Government Support and Forecasts Drew a Different Tone
Amid reports of strikes and power cuts, posts about government assistance stood out for their different tone.
Ukraine’s Points of Invincibility, public emergency support hubs, were mentioned in 78 posts. Subsidies and winter assistance programs appeared in 76. In both categories, only 5% of posts were classified as negative — far below the share recorded for outage schedules.
A low share of negative posts does not necessarily mean strong public approval of these programs. Much of the content came from official sources and information pages sharing details about available services and assistance.
Calls to prepare for a “difficult winter” were another recurring story. Of the 79 posts in this category, 34 appeared in the August sample — around 43%. Unlike many other prominent stories, warnings about a difficult winter were already being discussed well before late September.
Experts cited in these posts offered different assessments. Some warned of an exceptionally difficult heating season, while others did not expect conditions to be worse than the previous winter.
The conversation was therefore shaped by several different kinds of content. Attacks and outage schedules generated the strongest response, forecasts kept future risks in focus, and government announcements provided information about available support.
How People Responded
A rise in negative coverage did not mean that everyone reacted to winter-related threats in the same way. Alongside criticism of the authorities and worries about power outages, personal posts also described preparations, ways of adapting to possible difficulties, and a determination to get through another challenging heating season.
To look more closely at these reactions, we examined posts from personal accounts. Of 789 unique texts, 219 expressed a clear opinion. Including repeated posts, the sample used to analyze attitudes contained 239 posts.
These findings show which reactions appeared among the selected authors. They cannot tell us how attitudes changed across Ukraine as a whole. The samples are also relatively small, so differences of just a few percentage points need to be interpreted with particular caution.
Frustration Remained the Most Common Reaction, but Its Share Declined
In 49% of posts expressing a clear opinion, authors voiced dissatisfaction with the government or responsible public services. Common criticisms concerned funding for winter preparations, the operation of Points of Invincibility, the condition of shelters, and communication with the public.
One post captured that frustration:
“Now we’re just waiting for the authorities to start preparing the power grid for winter — instead of people’s emotions.”
But the balance shifted between the two periods. In August, 63% of opinion-bearing posts expressed dissatisfaction with government authorities or public services. In the September 28–October 7 sample, the figure was 43%.
That 20-percentage-point decline does not mean the authors had become more trusting of the government or more satisfied with its preparations. It means other types of reactions became relatively more visible in the later sample.
Anxiety and Resilience Increased Side by Side
In the later sample, the share of posts expressing anxiety or exhaustion rose from 18% to 25%. At the same time, posts emphasizing resilience and adaptation increased from 9% to 20%, while those discussing personal preparations rose from 11% to 18%.
These reactions were not necessarily at odds with one another.
Some posts conveyed the exhaustion of living with constant uncertainty:
“I just want some peace and quiet… and to turn on the lights without a generator.”
Others struck a more determined note:
“We were mentally prepared… we’ll get through every challenge together.”
Humor remained another way of coping. One author wrote:
“Welcome to the season of scheduled power outages, everyone!”
The share of posts using irony or humor went from 21% to 17% between the two periods.
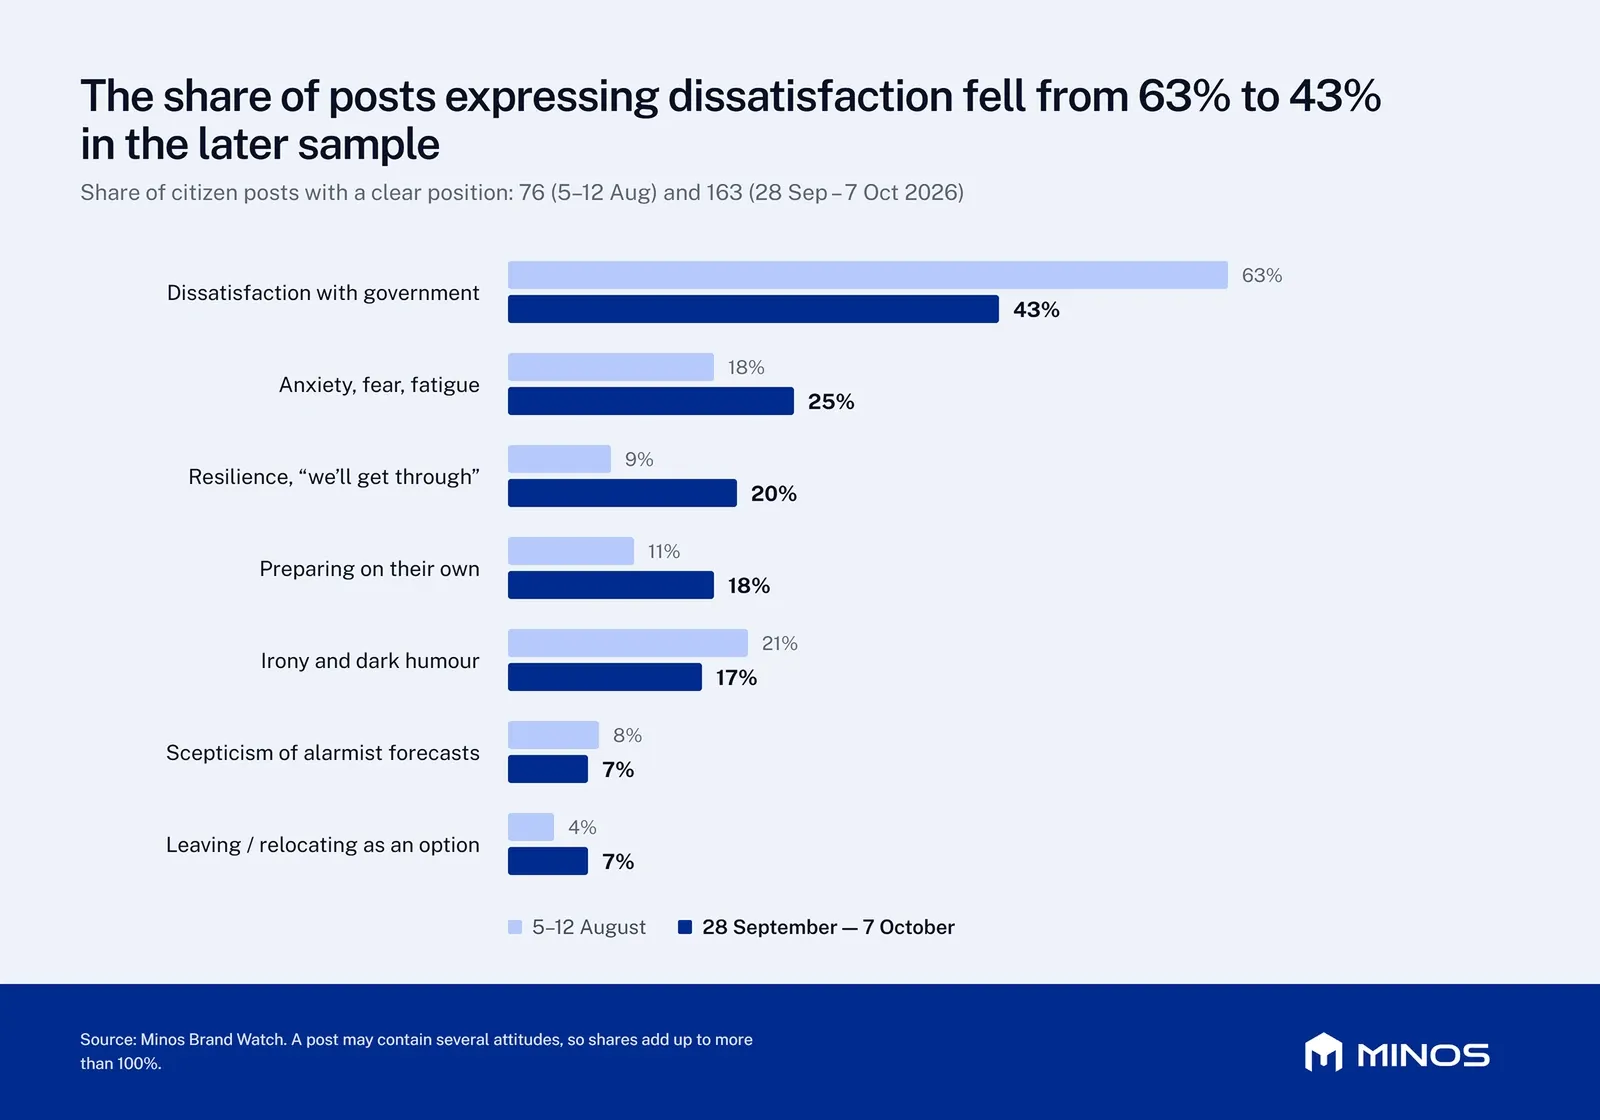
Source: Minos Brand Watch. Comparison of 76 posts expressing a clear opinion from August 5–12 and 163 from September 28–October 7, 2026, including repeated posts. A single post could express more than one reaction, so the percentages add up to more than 100%.
Did Anxiety Turn Into Panic?
Despite the growing attention to threats, posts expressing outright panic were rare in the analyzed sample.
Relocation came up relatively rarely, too. It appeared in 14 posts expressing a clear opinion, or 6% of that sample. Its share rose from 4% to 7% between the two periods.
One post described plans to move from Kyiv to Lviv or Ivano-Frankivsk. But such messages cannot tell us how many people were seriously considering relocation or had decided to leave their cities.
The range of responses shows how differently people can react to the same threat. Dissatisfaction with the authorities remained the most common position in the later sample, but anxiety, resilience, and plans to prepare independently appeared more frequently alongside it.
That last point deserves a closer look: what practical steps were people discussing as winter approached?
How Ukrainians Described Their Own Preparations
Alongside anxiety and criticism, people also shared stories about steps they were taking to prepare. One woman wrote:
“I put off buying a portable power station for five years. Today, I finally bought one.”
To find out which preparations came up most often, we examined the full sample of 3,215 relevant posts — not just personal accounts, but also news coverage, information pages, and official sources.
Storing water was the most frequently mentioned measure, appearing in 187 posts. Portable power stations followed with 116 mentions, generators with 106, and power banks with 95. Inverters, batteries, and solar panels also drew attention, appearing in 78 posts.
Two basic needs stood out in these discussions: access to water and the ability to keep electrical devices running during outages.
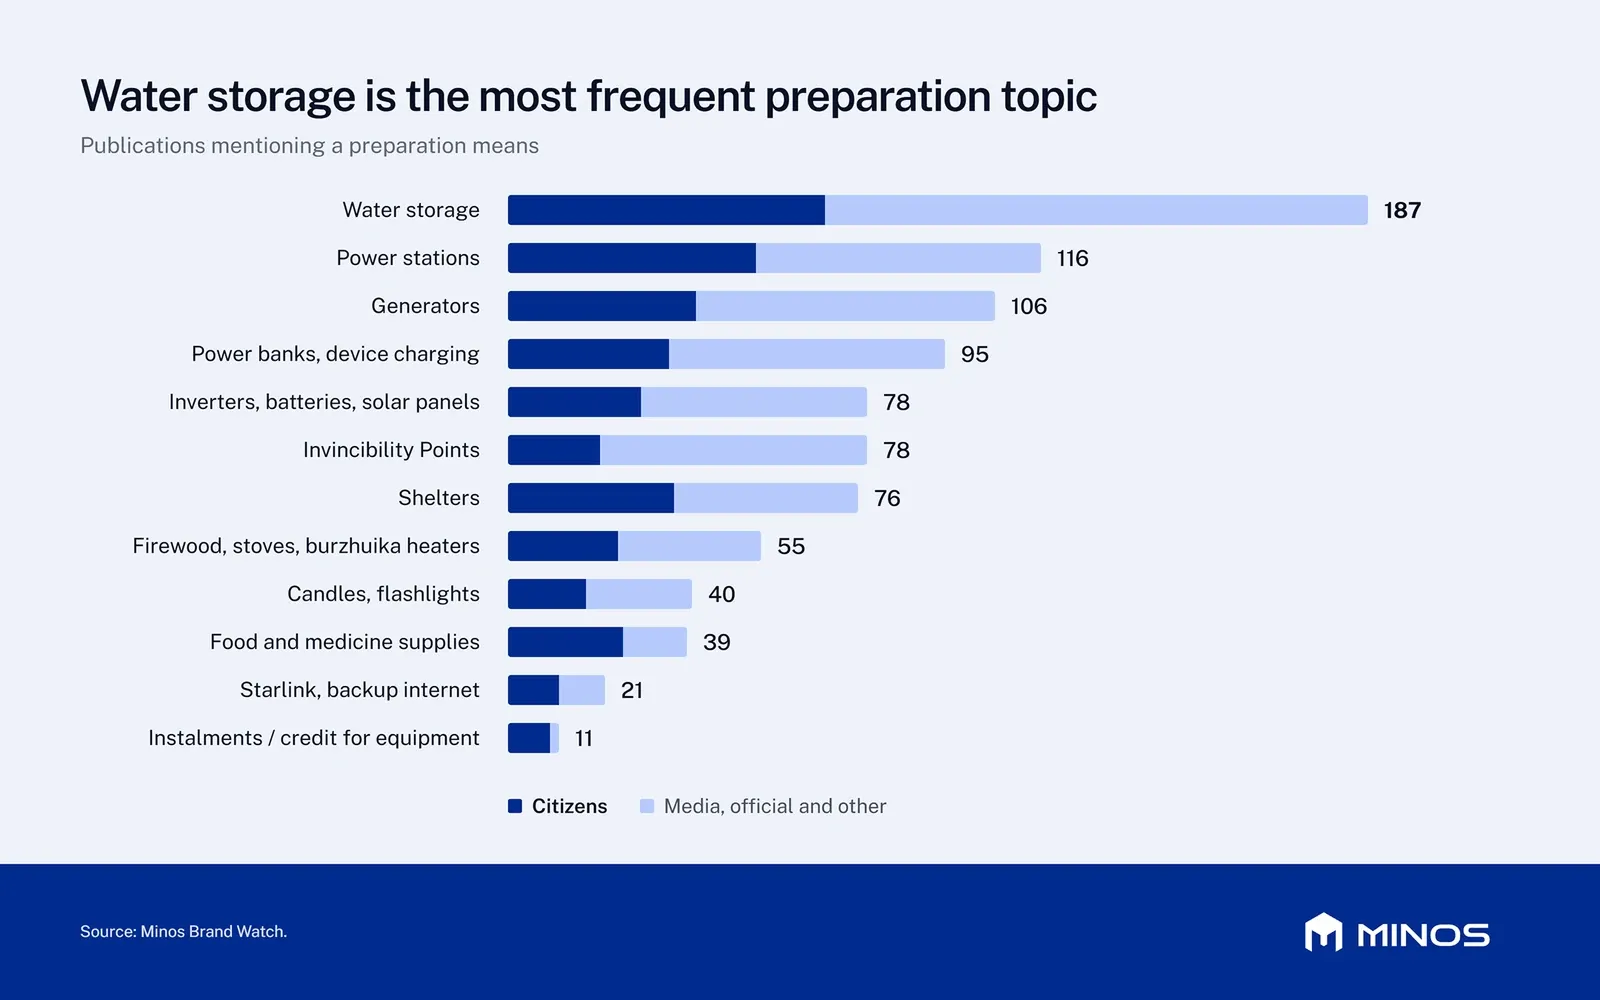
Source: Minos Brand Watch. Number of posts mentioning each preparation measure in the relevant sample. A single post could mention several categories.
Other preparations came up less often. These included shelters (76 posts), firewood and stoves (55), candles and flashlights (40), and food and medicine supplies (39). Backup internet connections, including Starlink, appeared in 21 posts.
The mix of topics also varied by source type. Personal accounts were responsible for 47% of mentions of portable power stations. By contrast, only 26% of posts about Points of Invincibility came from personal accounts. Most coverage of those facilities came from communities, public services, and other sources.
This distinction reveals two strands of the conversation: individual decisions about water and backup power, and information about organized assistance, shared mainly by official and informational pages.
The number of mentions, however, does not tell us how many devices were purchased, how much water people stored, or how many households were ready for winter. It tells us which practical concerns appeared most frequently in the sources we studied.
Conclusions
The Minos study shows how the conversation about winter preparations changed between the two monitoring periods. In August, forecasts and warnings about possible difficulties were among the prominent topics. By late September and early October, reports of Russian strikes, infrastructure risks, and outage schedules were driving much of the conversation. The largest spikes in activity coincided with specific events and threats.
That shift was also reflected in the classification of posts: the share of negative content rose from 23% in the August sample to 38% in October. Yet personal posts expressing a clear opinion told a more complicated story. Dissatisfaction with government authorities and public services remained the most common reaction, but its share declined in the later sample. Expressions of anxiety, resilience, and personal preparation became more frequent. A rise in negative news coverage, in other words, should not be mistaken for a uniform response among the people discussing it.
Practical preparations had their own priorities. Water supplies and backup power devices were mentioned most often. Kyiv emerged as a particular focus of negative discussion, while leaving or relocating remained a relatively minor topic among personal posts expressing a clear opinion. These are areas worth continuing to monitor as the concerns raised in public discussions evolve.
Monitoring helps distinguish between breaking news, personal reactions, and conversations about ways to prepare. But it cannot establish how ready households, cities, or the energy system actually are for winter. Public attention to a threat, the emotions it provokes, and real-world preparedness are three different things — and they should not be confused.
Methodology and Limitations
This study is based on data collected using Minos Brand Watch by Molfar Intelligence. Monitoring covered two separate periods — August 5–12 and September 28–October 7, 2026 — across Facebook, Telegram, Threads, X, YouTube, and LinkedIn.
Searches used topic-related queries covering forecasts of a difficult winter, heating, electricity outages, threats to water supplies and communications, government assistance, and possible departures from cities.
Of the 6,547 posts initially identified, 3,332 were removed as irrelevant content, including advertising, unrelated everyday posts, and material outside the scope of the research. The final dataset contained 3,215 relevant posts, including 3,036 unique texts.
Topic categories, news stories, and preparation measures were identified using keyword lists, with manual checks of the sample. Sentiment was classified automatically. A single post could fall into multiple categories, meaning the combined percentages for different topics may exceed 100%.
Personal posts were examined separately to study individual reactions. Of 789 unique texts, 219 expressed a clear opinion, rising to 239 when repeated posts were included. This latter group formed the basis for comparing reactions between the two periods: 76 posts in August and 163 in late September and early October.
The estimated potential reach of approximately 559 million represents the combined audiences of the sources, not actual views or unique readers. Audiences can overlap across sources.
The findings describe public posts identified by Minos during the specified periods. They are two snapshots, not continuous monitoring of every discussion from August through October, and they are not a representative opinion survey of the Ukrainian population. Mentions of preparation measures do not indicate how well households are equipped, and post sentiment is not a measure of how prepared cities or Ukraine’s energy system are for winter.
What’s Changing in the Conversation Around Your Topic?
In this study, Minos data helped us track how specific events coincided with changes in the volume, focus, and tone of conversations about winter preparations. Minos Watch collects content from news outlets, social media, and Telegram channels, tracks mentions over time, identifies key sources, analyzes post sentiment, and helps organize information by topic. These insights can support deeper research into your brand, industry, or an issue that matters to the public.
FAQ
How many posts about preparations for winter 2026 did Minos analyze?
Of the 6,547 posts initially identified, 3,215 — approximately 49% — were included in the relevant sample. The remaining 3,332 were excluded as irrelevant.
Which periods and social media platforms did the study cover?
The study examined two separate periods: August 5–12 and September 28–October 7, 2026. Searches covered Facebook, Telegram, Threads, X (Twitter), YouTube, and LinkedIn. These were selected snapshots, not continuous monitoring throughout August, September, and October.
When did discussion of winter 2026 preparations peak?
The peak in the analyzed sample came on September 30, with 910 posts in one day. That was approximately 18 times the average of 50 posts per day recorded during August 5–12.
How did sentiment in posts about winter preparations change?
According to Minos, the share of posts classified as negative rose from 23% in the August sample to 38% in the October posts. Separately, among 239 personal posts expressing a clear opinion, including repeated posts, 49% showed dissatisfaction with government authorities or public services, while 23% expressed anxiety or exhaustion. These are different measures based on different samples.
Which winter preparation measures were mentioned most often on social media?
The most frequently mentioned measures were storing water (187 mentions), portable power stations (116), generators (106), and power banks (95). These figures describe mentions in posts, not the number of purchases made or households prepared.
What did the Minos study find about discussions of Kyiv’s winter preparations?
Kyiv appeared in 742 posts — approximately 23% of the relevant sample. Minos classified 56% of posts about the capital as negative. This describes social media discussions, not Kyiv’s actual level of readiness for winter.
What does the potential reach of 559 million mean?
It is an estimate of the combined audiences of the sources that published the posts, not a count of unique readers or verified views. The same people may follow multiple sources, so the figure should not be interpreted as 559 million different people who saw the content.
Does the Minos study represent the views of all Ukrainians about winter 2026?
No. This is a sample-based analysis of public social media posts, not a representative opinion survey. The findings describe the content captured during the monitoring periods and cannot automatically be generalized to the entire population. Topic categories and types of reactions may overlap, so their percentages can sometimes add up to more than 100%.

This Signal Sits Inside the Minos Workflow
Watch
Detects relevant activity across configured sources and preserves the original evidence.
Explore →Risk
Assesses how serious the signal is and identifies what requires attention first.
Explore →Investigate
Uses Minos Profiler to quickly build a structured identity and risk profile from a known identifier.
Explore →Research
Adds analyst-led investigation when the available information is not enough to answer the wider question.
Explore →Response
Coordinates response plans with clear ownership, timing, and execution tracking.
Explore →See what Minos surfaces in your own information space
A 30-minute briefing on your own risk landscape — no slides, real data.